Debugging Basics
Accessing the Dev Menu
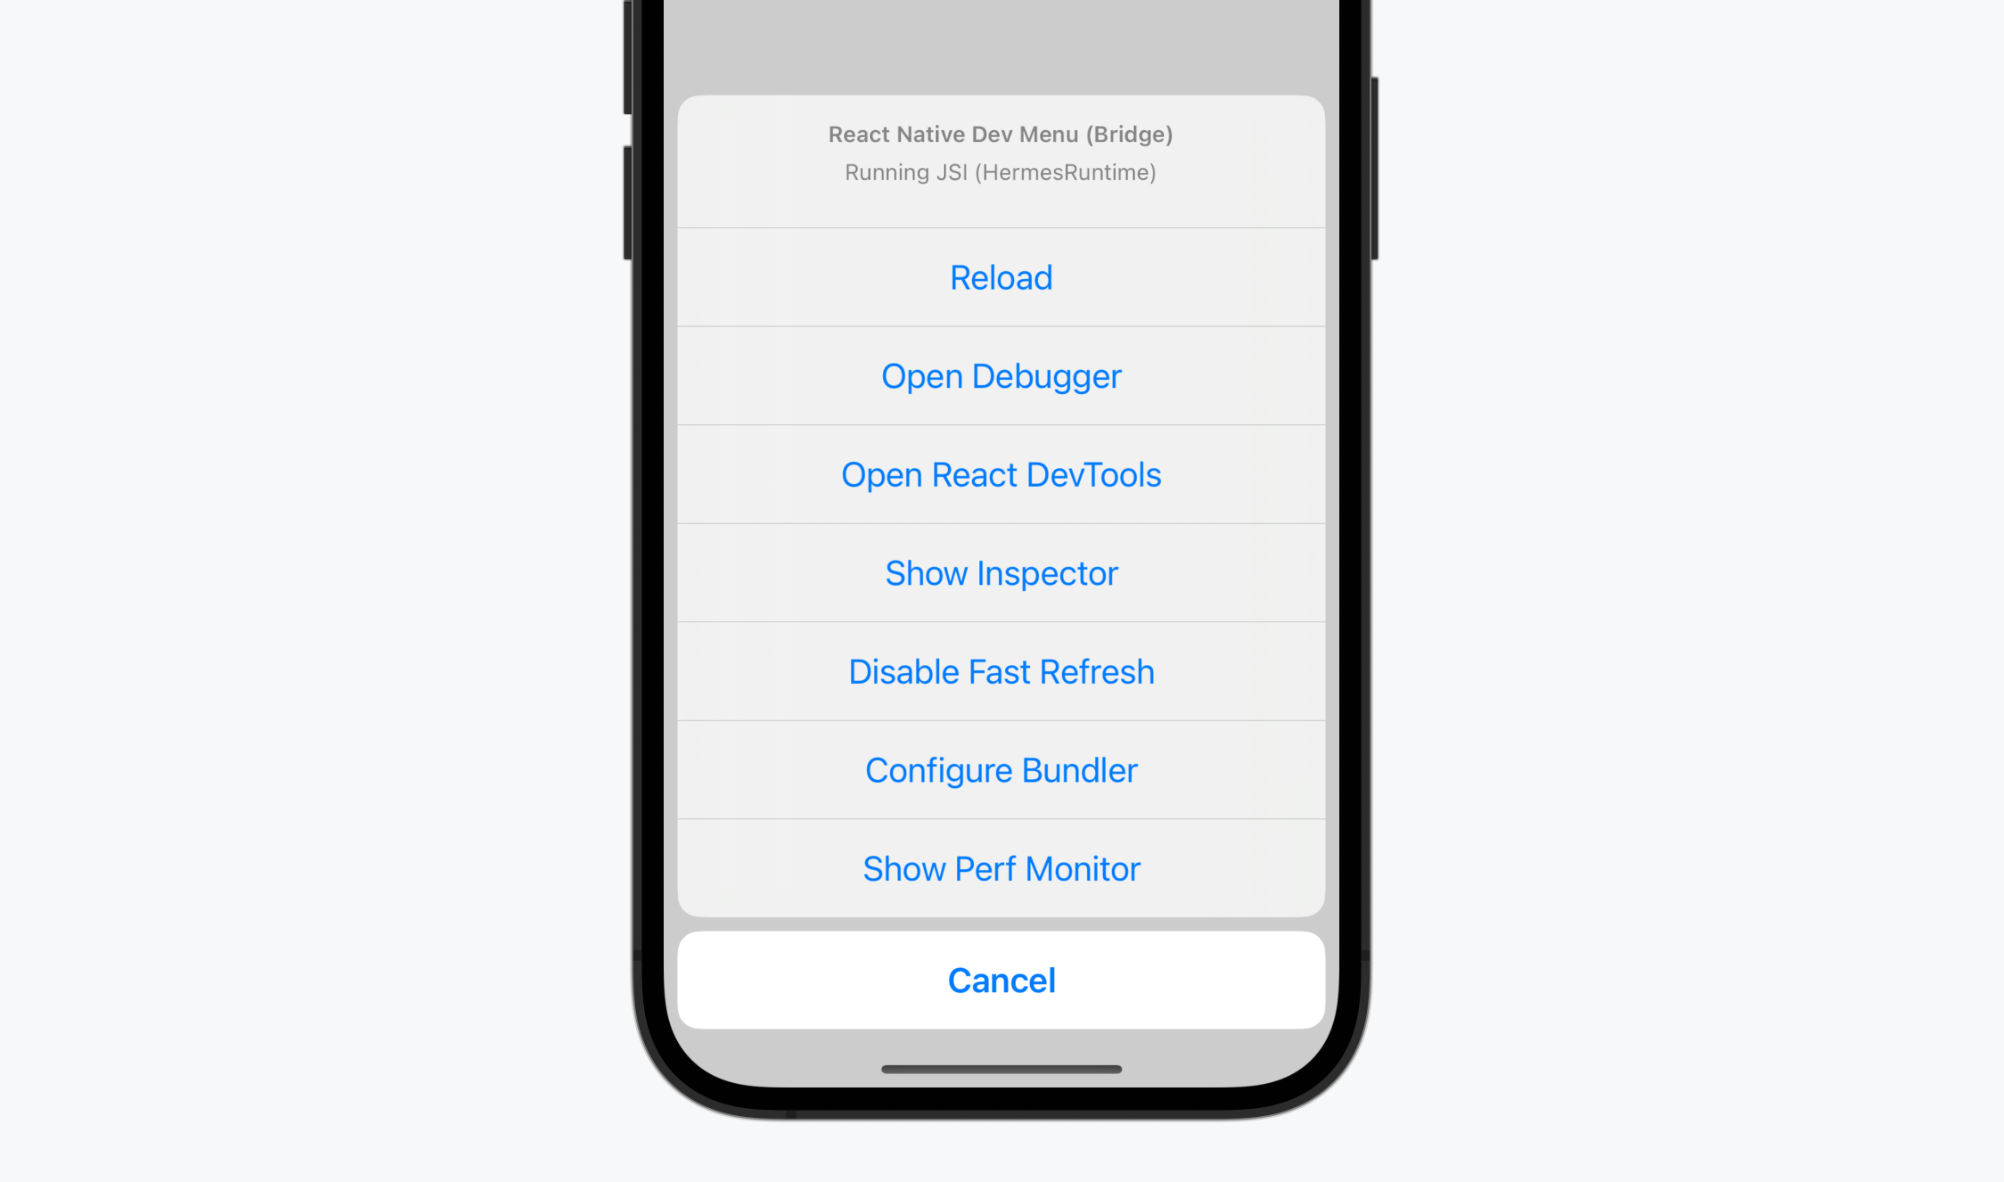
React Native provides an in-app developer menu which offers several debugging options. You can access the Dev Menu by shaking your device or via keyboard shortcuts:
- iOS Simulator: Cmd ⌘ + D (or Device > Shake)
- Android emulators: Cmd ⌘ + M (macOS) or Ctrl + M (Windows and Linux)
Alternatively for Android devices and emulators, you can run adb shell input keyevent 82 in your terminal.
The Dev Menu is disabled in release (production) builds.
LogBox
Errors and warnings in development builds are displayed in LogBox inside your app.
LogBox is disabled in release (production) builds.
Console Errors and Warnings
Console errors and warnings are displayed as on-screen notifications with a red or yellow badge, and the number of errors or warning in the console respectively. To view a console error or warnings, tap the notification to view the full screen information about the log and to paginate through all of the logs in the console.
These notifications can be hidden using LogBox.ignoreAllLogs(). This is useful when giving product demos, for example. Additionally, notifications can be hidden on a per-log basis via LogBox.ignoreLogs(). This is useful when there's a noisy warning that cannot be fixed, like those in a third-party dependency.
Ignore logs as a last resort and create a task to fix any logs that are ignored.
import {LogBox} from 'react-native';

// Ignore log notification by message:
LogBox.ignoreLogs(['Warning: ...']);

// Ignore all log notifications:
LogBox.ignoreAllLogs();
Unhandled Errors
Unhandled JavaScript errors such as undefined is not a function will automatically open a full screen LogBox error with the source of the error. These errors are dismissable and minimizable so that you can see the state of your app when these errors occur, but should always be addressed.
Syntax Errors
When syntax error occurs the full screen LogBox error will automatically open with the stack trace and location of the syntax error. This error is not dismissable because it represents invalid JavaScript execution that must be fixed before continuing with your app. To dismiss these errors, fix the syntax error and either save to automatically dismiss (with Fast Refresh enabled) or Cmd ⌘/Ctrl + R to reload (with Fast Refresh disabled).
Chrome Developer Tools
To debug JavaScript code in Chrome, select "Open Debugger" from the Dev Menu. This will open a new tab at http://localhost:8081/debugger-ui.
From here, select More Tools → Developer Tools from the Chrome menu to open Chrome DevTools. Alternatively, you can use the shortcut ⌥ Option + Cmd ⌘ + I (macOS) / Ctrl + Shift + I (Windows and Linux).
- If you're new to Chrome DevTools, we recommend learning about the Console and Sources tabs in the docs.
- You may want to enable Pause on Caught Exceptions for a better debugging experience.
The React Developer Tools Chrome extension does not work with React Native, but you can use its standalone version instead. Read this section to learn how.
On Android, if the times between the debugger and device have drifted, things such as animations and event behavior might not work properly. This can be fixed by running adb shell "date `date +%m%d%H%M%Y.%S%3N`". Root access is required if using a physical device.
Debugging on a physical device
If you're using Expo CLI, this is configured for you already.
- Android
- iOS
On iOS devices, open the file RCTWebSocketExecutor.mm and change "localhost" to the IP address of your computer, then select "Debug JS Remotely" from the Dev Menu.
On Android 5.0+ devices connected via USB, you can use the adb command line tool to set up port forwarding from the device to your computer:
adb reverse tcp:8081 tcp:8081
Alternatively, select "Settings" from the Dev Menu, then update the "Debug server host for device" setting to match the IP address of your computer.
If you run into any issues, it may be possible that one of your Chrome extensions is interacting in unexpected ways with the debugger. Try disabling all of your extensions and re-enabling them one-by-one until you find the problematic extension.
Advanced: Debugging using a custom JavaScript debugger
To use a custom JavaScript debugger in place of Chrome Developer Tools, set the REACT_DEBUGGER environment variable to a command that will start your custom debugger. You can then select "Open Debugger" from the Dev Menu to start debugging.
The debugger will receive a list of all project roots, separated by a space. For example, if you set REACT_DEBUGGER="node /path/to/launchDebugger.js --port 2345 --type ReactNative", then the command node /path/to/launchDebugger.js --port 2345 --type ReactNative /path/to/reactNative/app will be used to start your debugger.
Custom debugger commands executed this way should be short-lived processes, and they shouldn't produce more than 200 kilobytes of output.
Safari Developer Tools
You can use Safari to debug the iOS version of your app without having to enable "Debug JS Remotely".
- On a physical device go to:
Settings → Safari → Advanced → Make sure "Web Inspector" is turned on(This step is not needed on the Simulator) - On your Mac enable Develop menu in Safari:
Settings... (or Preferences...) → Advanced → Select "Show Develop menu in menu bar" - Select your app's JSContext:
Develop → Simulator (or other device) → JSContext - Safari's Web Inspector should open which has a Console and a Debugger
While sourcemaps may not be enabled by default, you can follow this guide or video to enable them and set break points at the right places in the source code.
However, every time the app is reloaded (using live reload, or by manually reloading), a new JSContext is created. Choosing "Automatically Show Web Inspectors for JSContexts" saves you from having to select the latest JSContext manually.
Performance Monitor
You can enable a performance overlay to help you debug performance problems by selecting "Perf Monitor" in the Dev Menu.