Other Debugging Methods

This page covers how to use legacy JavaScript debugging methods. If you are getting started with a new React Native or Expo app, we recommend using React Native DevTools.

Safari Developer Tools (direct JSC debugging)

You can use Safari to debug the iOS version of your app when using JavaScriptCore (JSC) as your app's runtime.

  1. Physical devices only: Open the Settings app, and navigate to Safari > Advanced, and make sure "Web Inspector" is turned on.
  2. On your Mac, open Safari and enable the Develop menu. This can be found under Safari > Settings..., then the Advanced tab, then selecting "Show features for web developers".
  3. Find your device under the Develop menu, and select the "JSContext" item from the submenu. This will open Safari's Web Inspector, which includes Console and Sources panels similar to Chrome DevTools.
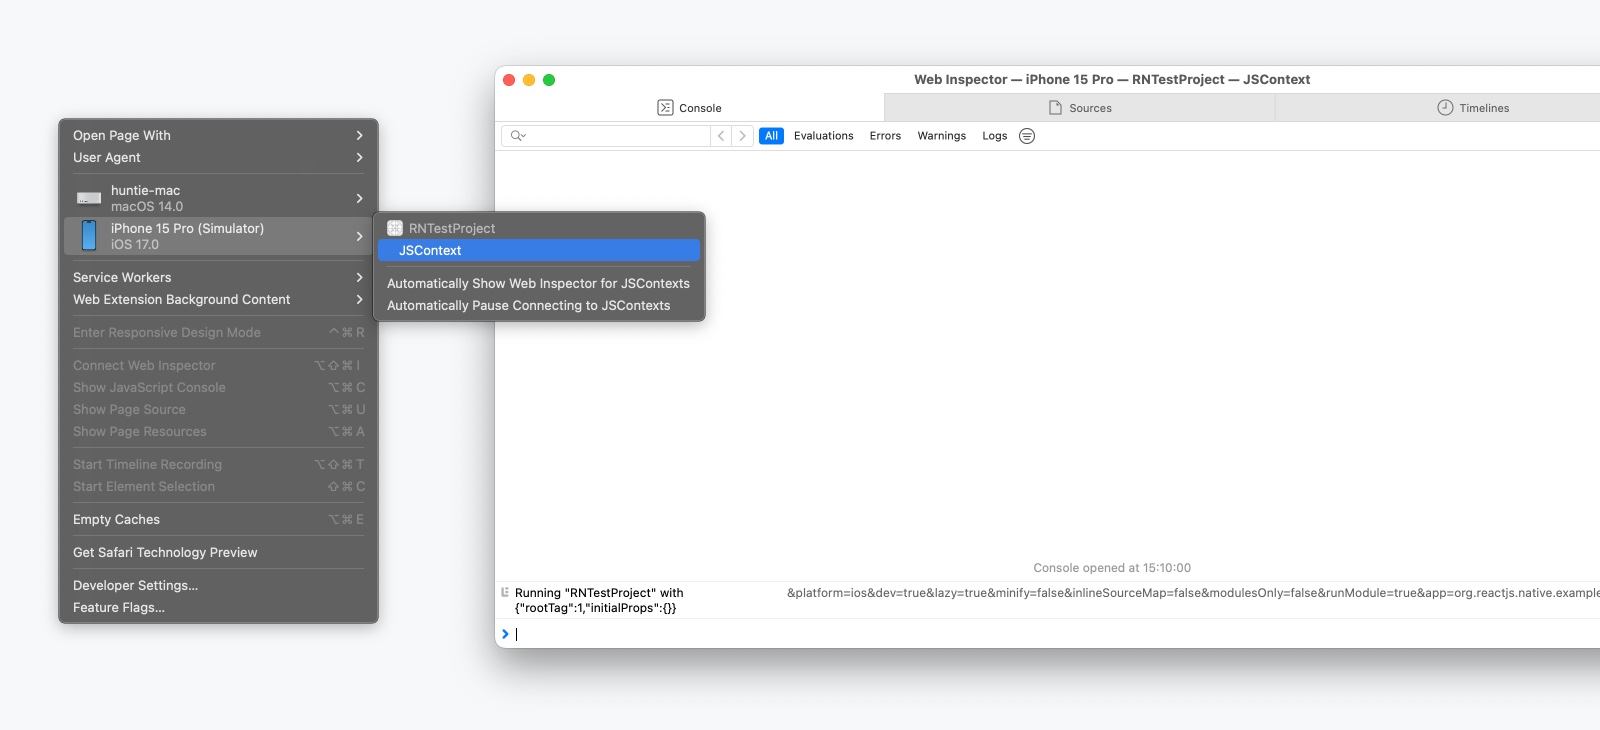
Opening Safari Web Inspector

tip

While source maps may not be enabled by default, you can follow this guide or video to enable them and set break points at the right places in the source code.

tip

Every time the app is reloaded, a new JSContext is created. Choosing "Automatically Show Web Inspectors for JSContexts" saves you from having to select the latest JSContext manually.

Remote JavaScript Debugging (deprecated)

warning

Remote JavaScript Debugging is deprecated in React Native 0.73 and will be removed in a future release.

Remote JavaScript Debugging connects an external web browser (Chrome) to your app and runs your JavaScript code inside a web page. This allows you to use Chrome's debugger as you would with any web app. Note that the browser environment can be very different, and not all React Native modules will work when debugging this way.

Setup

Since React Native 0.73, Remote JavaScript Debugging must be manually enabled using the NativeDevSettings module.

js
import NativeDevSettings from 'react-native/Libraries/NativeModules/specs/NativeDevSettings';

function MyApp() {
// Assign this to a dev-only button or useEffect call
const connectToRemoteDebugger = () => {
NativeDevSettings.setIsDebuggingRemotely(true);
};
}

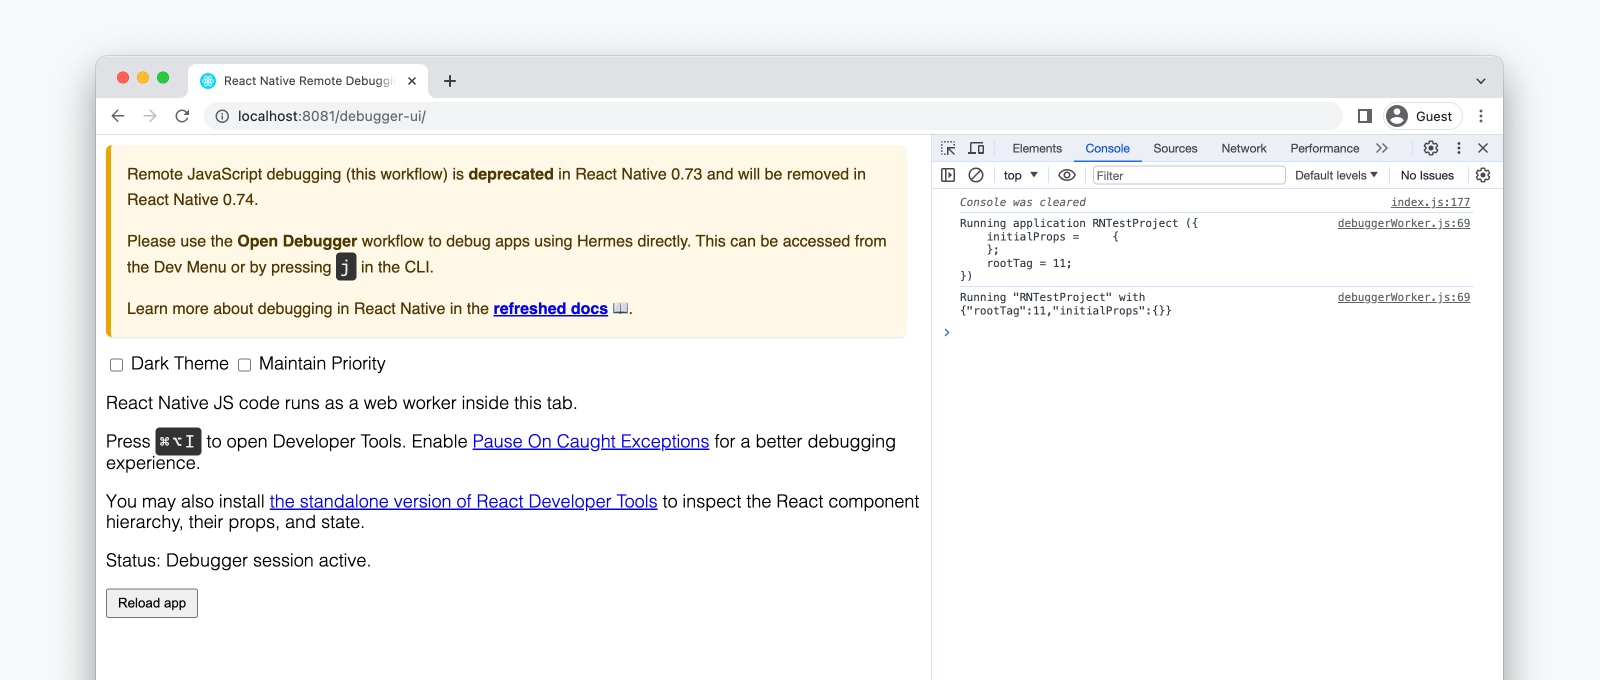
When NativeDevSettings.setIsDebuggingRemotely(true) is invoked, this will open a new tab at http://localhost:8081/debugger-ui.

From this page, open Chrome DevTools via:

  • View > Developer > Developer Tools
  • ⌥ Option + Cmd ⌘ + I (macOS) / Ctrl + Shift + I (Windows and Linux).

The Console and Sources panels will allow you to inspect your React Native code.

The remote debugger window in Chrome

info

Under Remote JavaScript Debugging, the web version of React DevTools in Chrome will not work with React Native. See the React Native DevTools guide to explore how to use React DevTools in our integrated debugger.

note

On Android, if the times between the debugger and device have drifted, things such as animations and event behavior might not work properly. This can be fixed by running adb shell "date `date +%m%d%H%M%Y.%S%3N`". Root access is required if using a physical device.

Debugging on a physical device

info

If you're using Expo CLI, this is configured for you already.

On Android 5.0+ devices connected via USB, you can use the adb command line tool to set up port forwarding from the device to your computer:

sh
adb reverse tcp:8081 tcp:8081
note

If you run into any issues, it may be possible that one of your Chrome extensions is interacting in unexpected ways with the debugger. Try disabling all of your extensions and re-enabling them one-by-one until you find the problematic extension.