React Native DevTools
React Native DevTools is our modern debugging experience for React Native. Purpose-built from the ground up, it aims to be fundamentally more integrated, correct, and reliable than previous debugging methods.
React Native DevTools is designed for debugging React app concerns, and not to replace native tools. If you want to inspect React Native’s underlying platform layers (for example, while developing a Native Module), please use the debugging tools available in Android Studio and Xcode (see Debugging Native Code).
💡 Compatibility — released in 0.76
React Native DevTools supports all React Native apps running Hermes. It replaces the previous Flipper, Experimental Debugger, and Hermes debugger (Chrome) frontends.
It is not possible to set up React Native DevTools with any older versions of React Native.
- Chrome Browser DevTools — unsupported
- Connecting to React Native via
chrome://inspectis no longer supported. Features may not work correctly, as the latest versions of Chrome DevTools (which are built to match the latest browser capabilities and APIs) have not been tested, and this frontend lacks our customisations. Instead, we ship a supported version with React Native DevTools.
- Connecting to React Native via
- Visual Studio Code — unsupported (pre-existing)
- Third party extensions such as Expo Tools and Radon IDE may have improved compatibility, but are not directly supported by the React team.
💡 Feedback & FAQs
We want the tooling you use to debug React across all platforms to be reliable, familiar, simple, and cohesive. All the features described on this page are built with these principles in mind, and we also want to offer more capabilities in future.
We are actively iterating on the future of React Native DevTools, and have created a centralized GitHub discussion to keep track of issues, frequently asked questions, and feedback.
Core features
React Native DevTools is based on the Chrome DevTools frontend. If you have a web development background, its features should be familiar. As a starting point, we recommend browsing the Chrome DevTools docs which contain full guides as well as video resources.
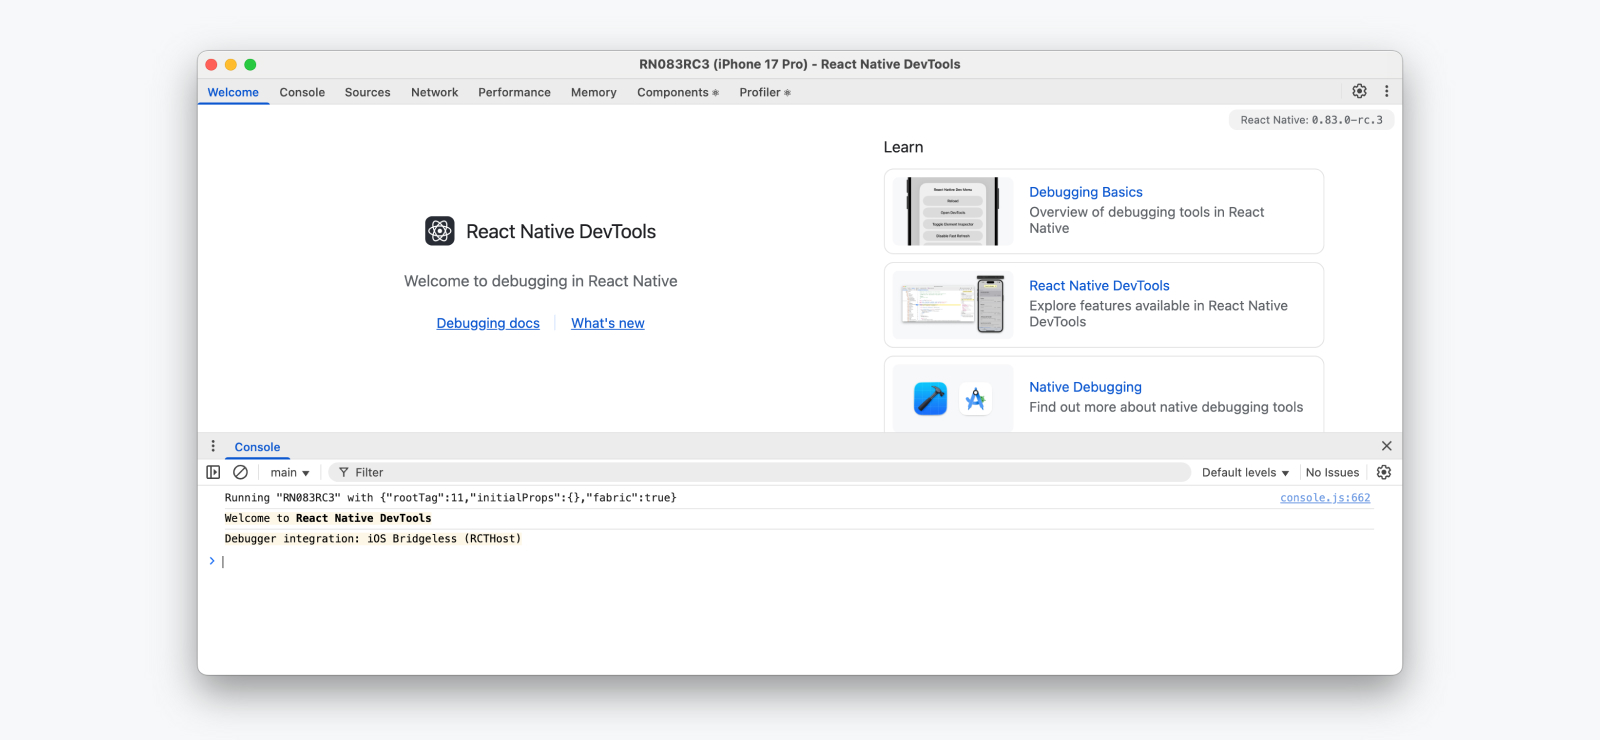
Console
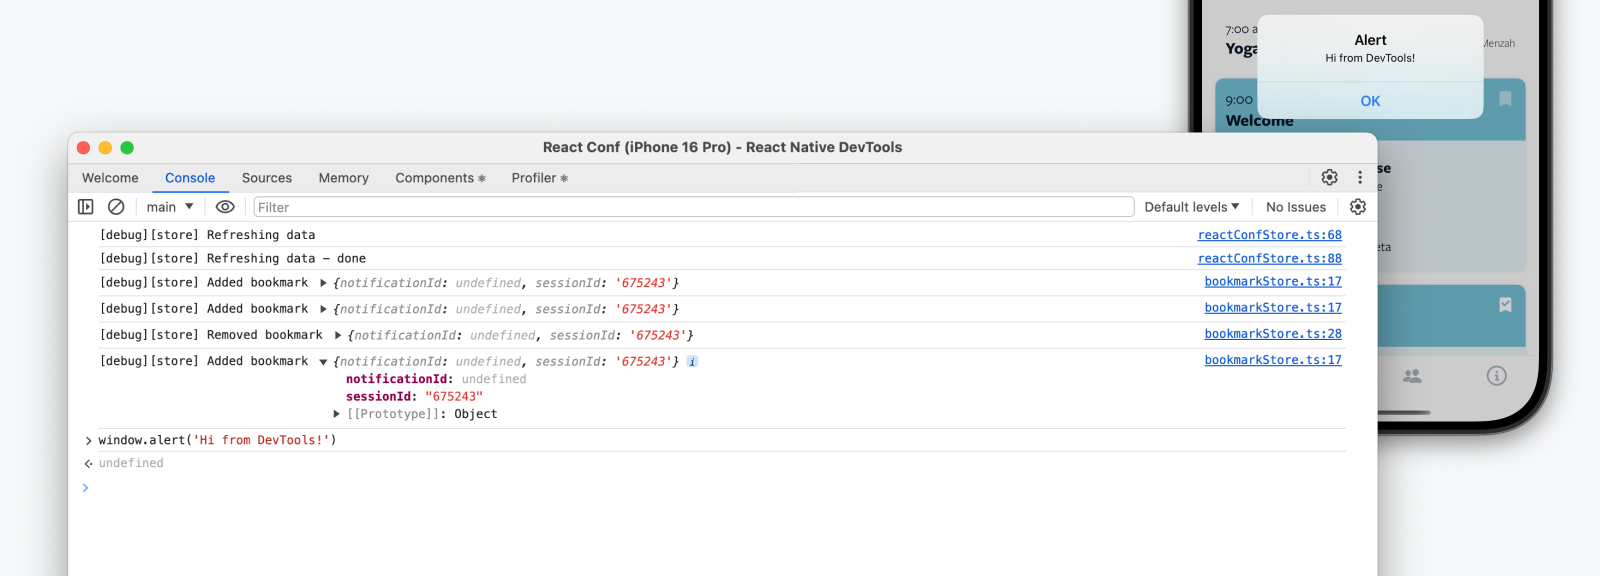
The Console panel allows you to view and filter messages, evaluate JavaScript, inspect object properties, and more.
Console features reference | Chrome DevTools
Useful tips
- If your app has a lot of logs, use the filter box or change the log levels that are shown.
- Watch values over time with Live Expressions.
- Persist messages across reloads with Preserve Logs.
- Use Ctrl + L to clear the console view.
Sources & breakpoints
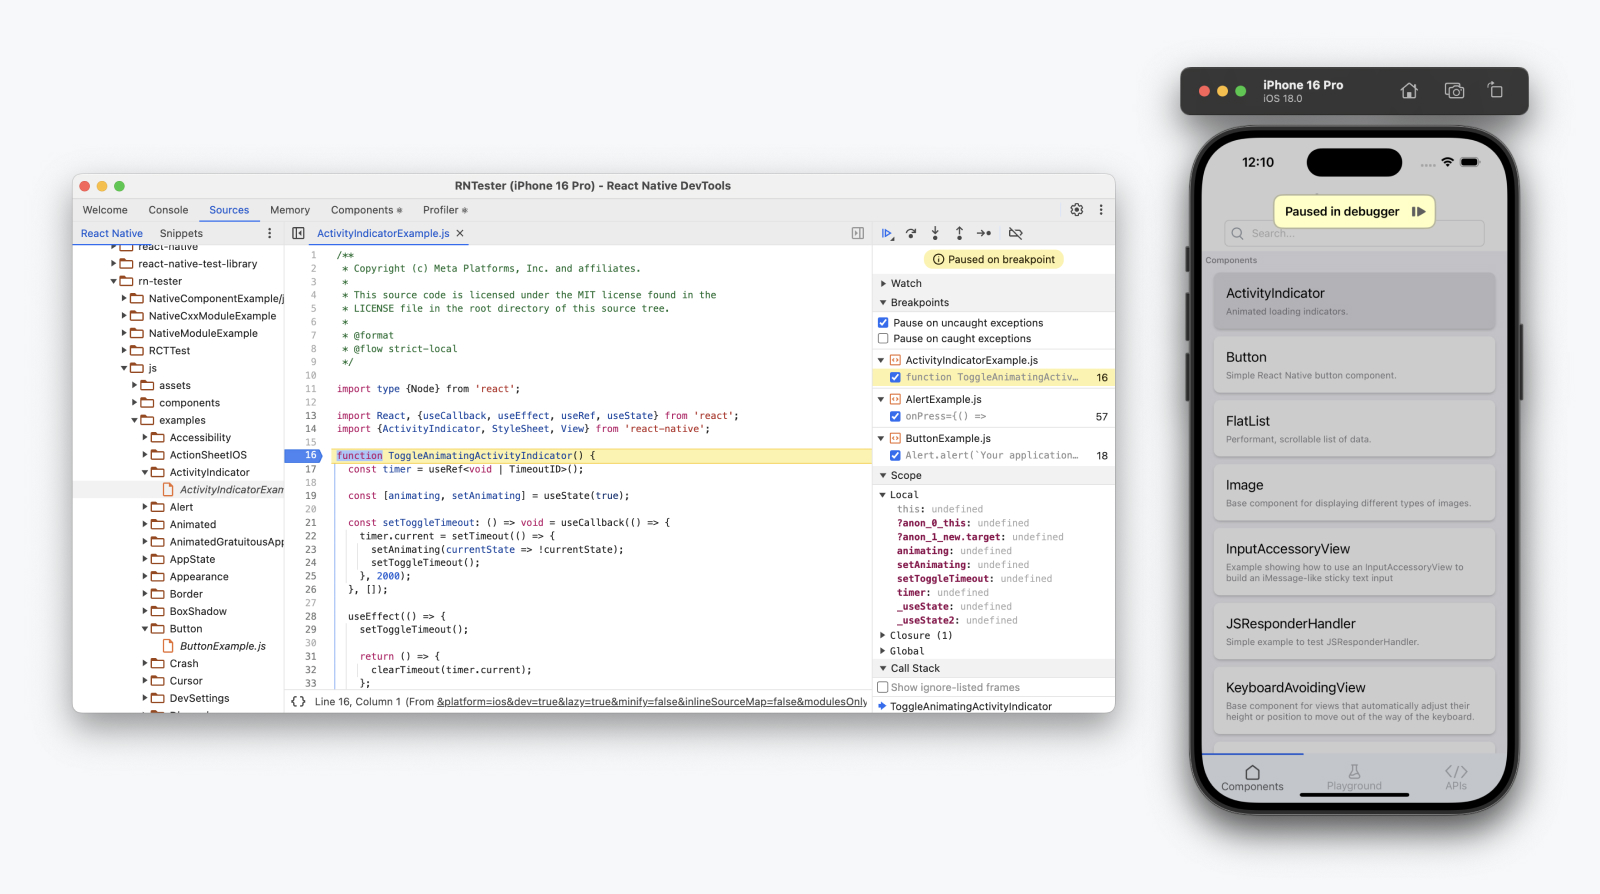
The Sources panel allows you to view the source files in your app and register breakpoints. Use a breakpoint to define a line of code where your app should pause — allowing you to inspect the live state of the program and incrementally step through code.
Pause your code with breakpoints | Chrome DevTools
Mini-guide
Breakpoints are a fundamental tool in your debugging toolkit!
- Navigate to a source file using the sidebar or Cmd ⌘+P / Ctrl+P.
- Click in the line number column next to a line of code to add a breakpoint.
- Use the navigation controls at the top right to step through code when paused.
Useful tips
- A "Paused in Debugger" overlay appears when your app is paused. Tap it to resume.
- Pay attention to the right-hand panels when on a breakpoint, which allow you to inspect the current scope and call stack, and set watch expressions.
- Use a
debugger;statement to quickly set a breakpoint from your text editor. This will reach the device immediately via Fast Refresh. - There are multiple kinds of breakpoints! For example, Conditional Breakpoints and Logpoints.
Network Since 0.83
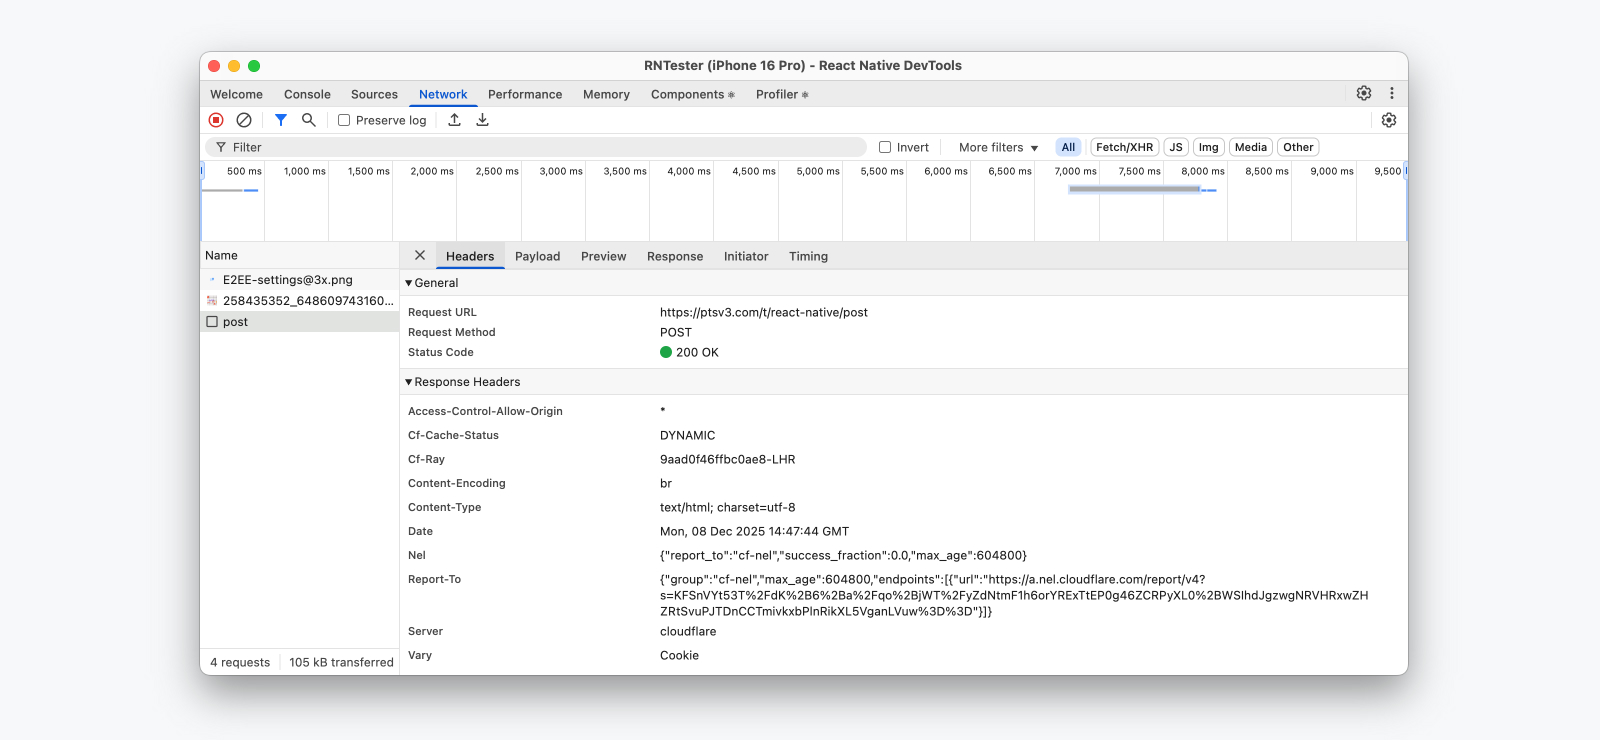
The Network panel allows you to view and inspect the network requests made by your app. Logged requests provide detailed metadata such as timings and headers sent/received, as well as response previews.
Network requests are recorded automatically when DevTools is open. We support most features from Chrome, with some exceptions. See more below.
💡 Network event coverage, Expo support
Which network events are captured?
Today, we record all network calls through fetch(), XMLHttpRequest, and <Image> — with support for custom networking libraries, such as Expo Fetch, coming later.
Expo Network differences
Because of this, apps using Expo will continue to see the "Expo Network" panel — a separate implementation by the Expo framework which will log these additional request sources but has slightly reduced features.
- Coverage for Expo-specific network events.
- No request initiator support.
- No Performance panel integration.
We're working with Expo to integrate Expo Fetch and third party networking libraries with our new Network inspection pipeline in future releases.
Unimplemented features
At launch, these are the features we don't yet support in React Native:
- WebSocket events
- Network response mocking
- Simulated network throttling
💡 Response previews buffer size
If you are inspecting a large volume of response data, please note that response previews are cached in an on-device buffer with a maximum size of 100MB. This means we may evict response previews (but not metadata) if the cache becomes too large, oldest request first.
Useful tips
- Use the Initiator tab to see the call stack of where a network request was initiated in your app.
- Network events will also be shown in the Network track in the Performance panel.
Performance Since 0.83
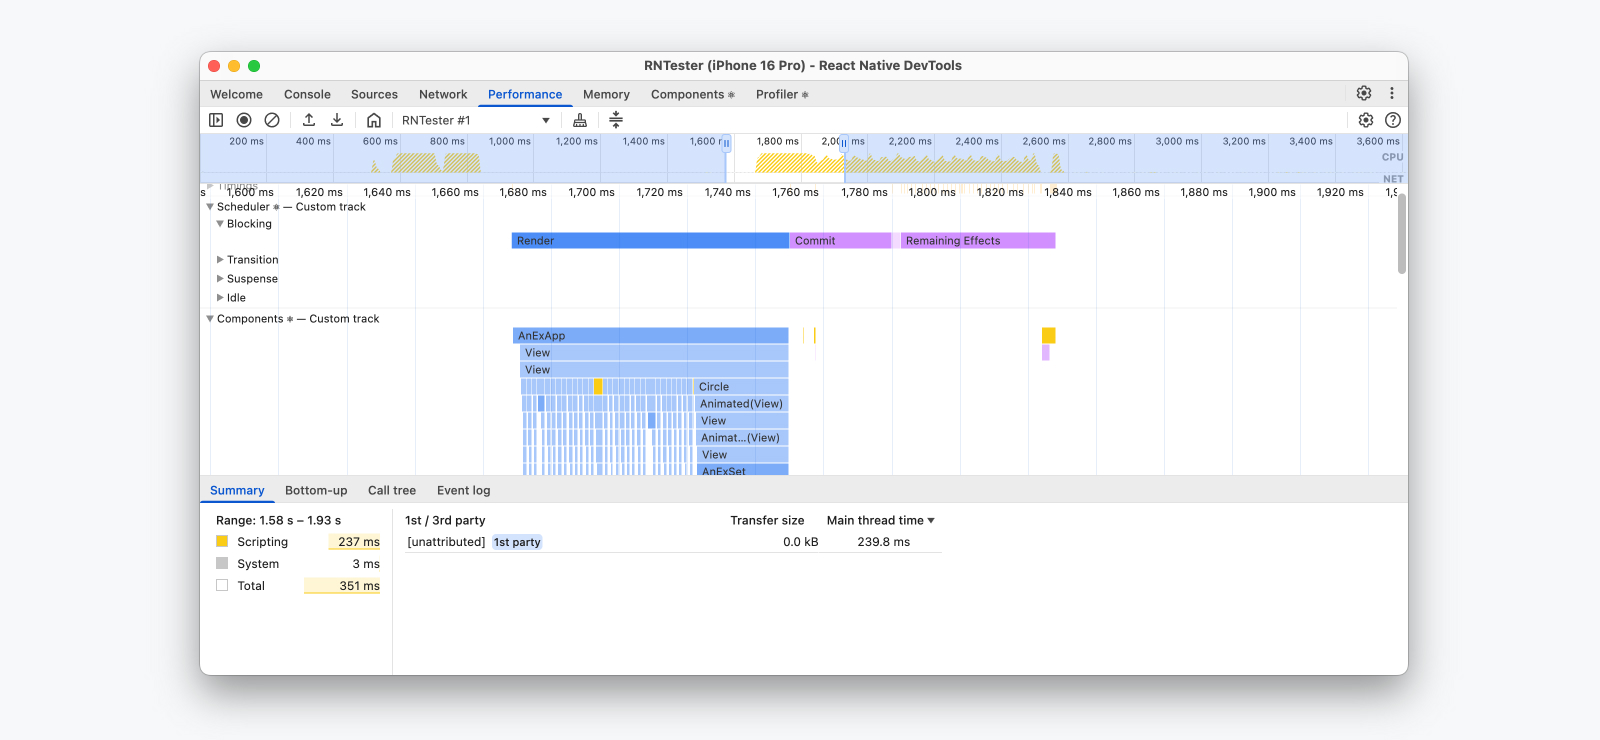
Performance tracing allows you to record a performance session within your app to understand how your JavaScript code is running and what operations took the most time. In React Native, we show JavaScript execution, React Performance tracks, Network events, and custom User Timings, rendered in a single performance timeline.
Useful tips
- Use Annotations (shift-drag) to label and mark up a performance trace — useful before downloading and sharing a trace with a teammate. Annotations also provide a quick way to gauge time spans in seconds.
- Use the
PerformanceObserverAPI in your app to observe performance events at runtime — useful if you want to capture performance telemetry.
Learn more
- React Performance tracks
- Performance APIs > User Timings | MDN
- "Debug Like a Senior — React Native Performance Panel" | Software Mansion
Memory
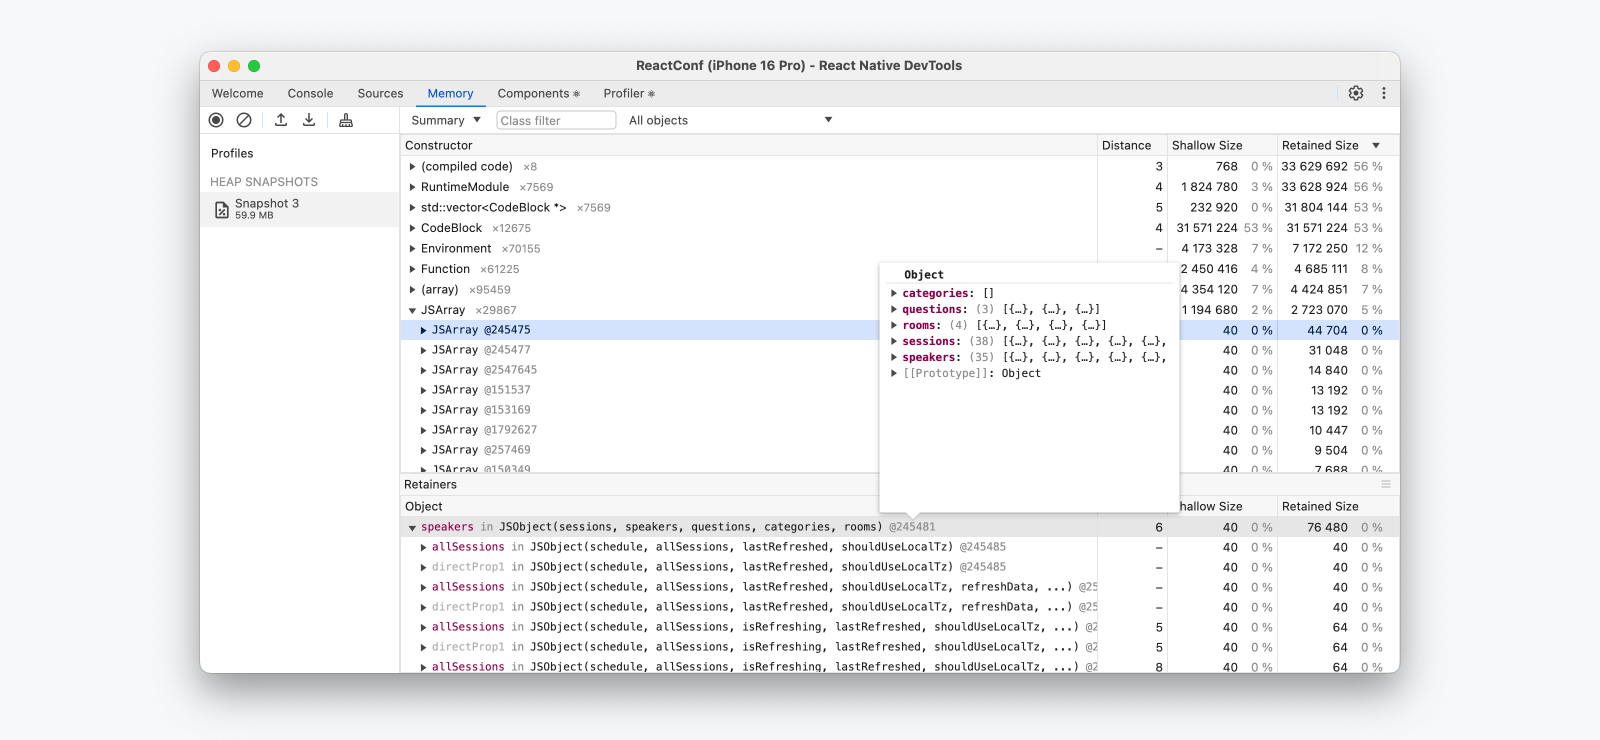
The Memory panel allows you to take a heap snapshot and view the memory usage of your JavaScript code over time.
Record heap snapshots | Chrome DevTools
Useful tips
- Use Cmd ⌘+F / Ctrl+F to filter for specific objects in the heap.
- Taking an allocation timeline report can be useful to see memory usage over time as a graph, to identify possible memory leaks.
React DevTools features
In the integrated Components and Profiler panels, you'll find all the features of the React DevTools browser extension. These work seamlessly in React Native DevTools.
React Components
The React Components panel allows you to inspect and update the rendered React component tree.
- Hover or select an element in DevTools to highlight it on the device.
- To locate an element in DevTools, click the top-left "Select element" button, then tap any element in the app.
Useful tips
- Props and state on a component can be viewed and modified at runtime using the right hand panel.
- Components optimized with React Compiler will be annotated with a "Memo ✨" badge.
Protip: Highlight re-renders
Re-renders can be a significant contributor to performance issues in React apps. DevTools can highlight component re-renders as they happen.
- To enable, click the View Settings (
⚙︎) icon and check "Highlight updates when components render".
React Profiler
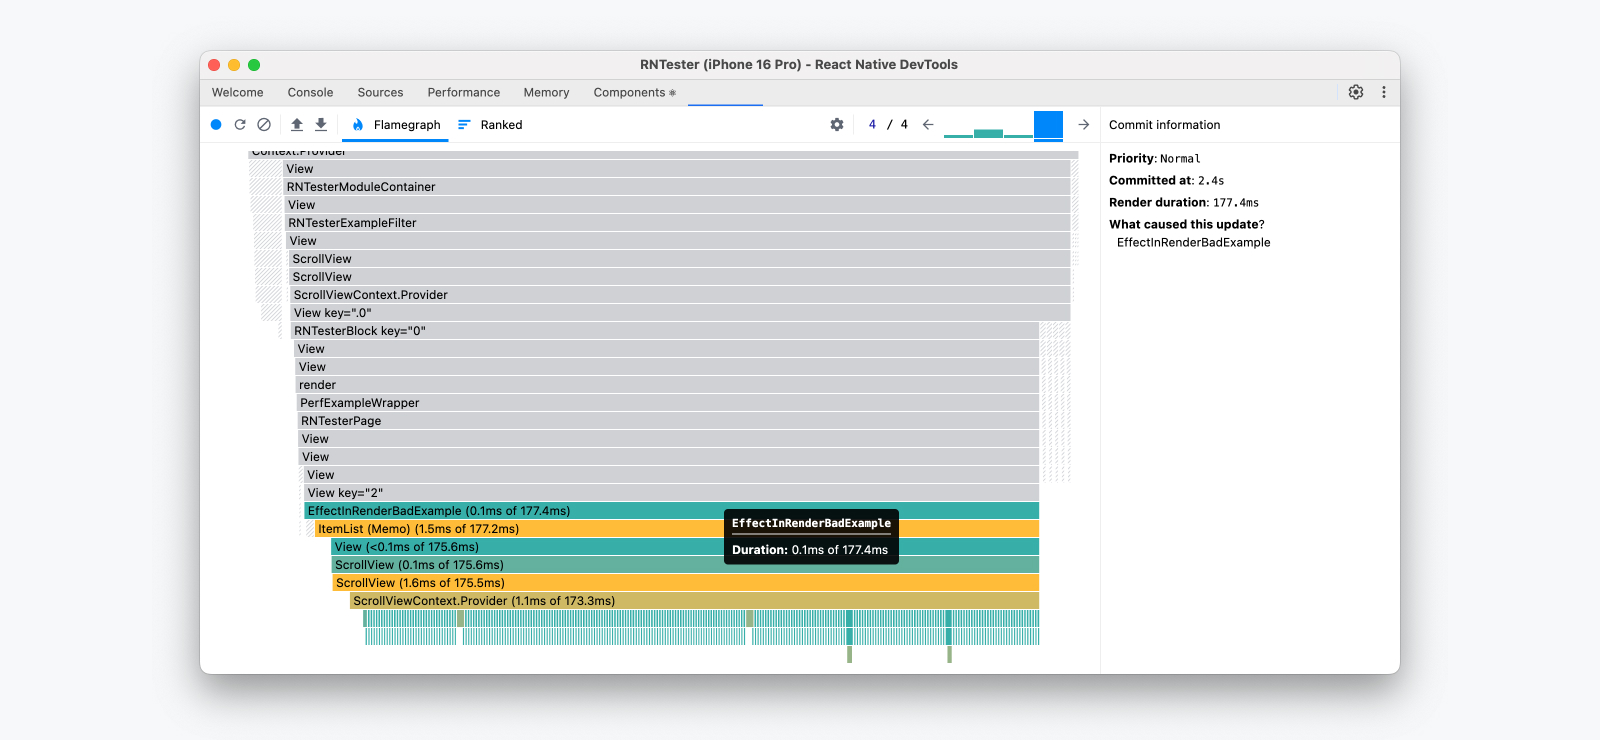
The React Profiler panel allows you to record performance profiles to understand the timing of component renders and React commits.
For more info, see the original 2018 guide (note that parts of this may be outdated).
Reconnecting DevTools
Occasionally, DevTools might disconnect from the target device. This can happen if:
- The app is closed.
- The app is rebuilt (a new native build is installed).
- The app crashes on the native side.
- The dev server (Metro) is quit.
- A physical device is disconnected.
On disconnect, a dialog will be shown with the message "Debugging connection was closed".
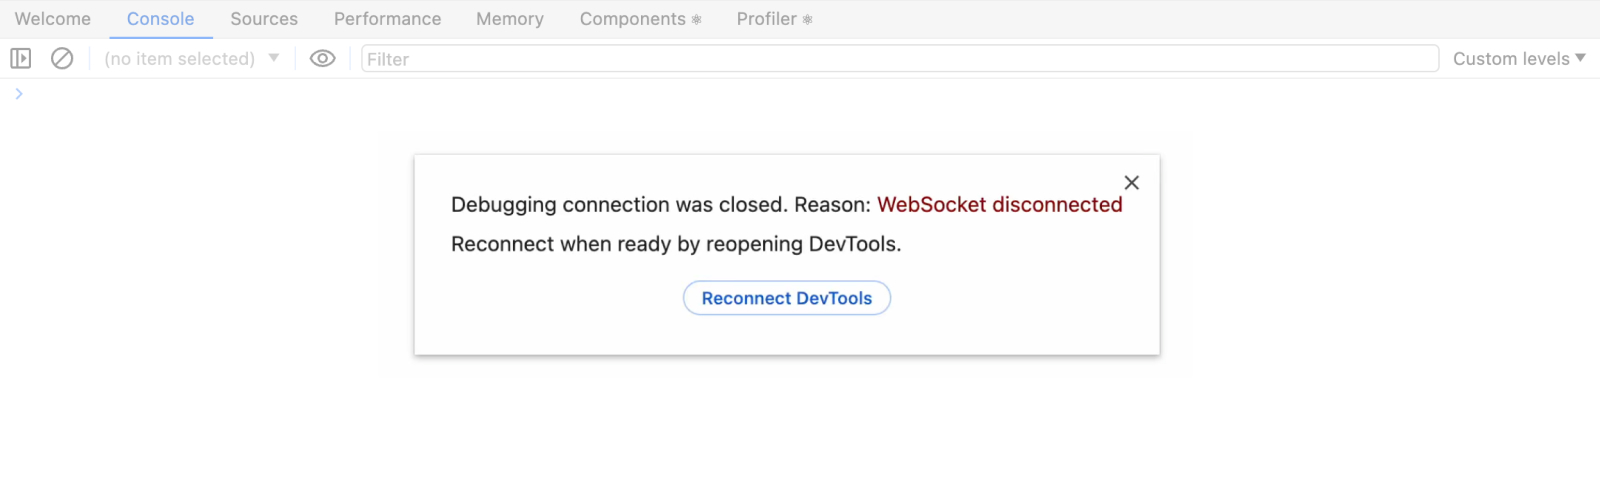
From here, you can either:
- Dismiss: Select the close (
×) icon or click outside the dialog to return to the DevTools UI in the last state before disconnection. - Reconnect: Select "Reconnect DevTools", having addressed the reason for disconnection.