Other Debugging Methods
This page covers how to use legacy JavaScript debugging methods. If you are getting started with a new React Native or Expo app, we recommend using React Native DevTools.
Safari Developer Tools (direct JSC debugging)
You can use Safari to debug the iOS version of your app when using JavaScriptCore (JSC) as your app's runtime.
- Physical devices only: Open the Settings app, and navigate to Safari > Advanced, and make sure "Web Inspector" is turned on.
- On your Mac, open Safari and enable the Develop menu. This can be found under Safari > Settings..., then the Advanced tab, then selecting "Show features for web developers".
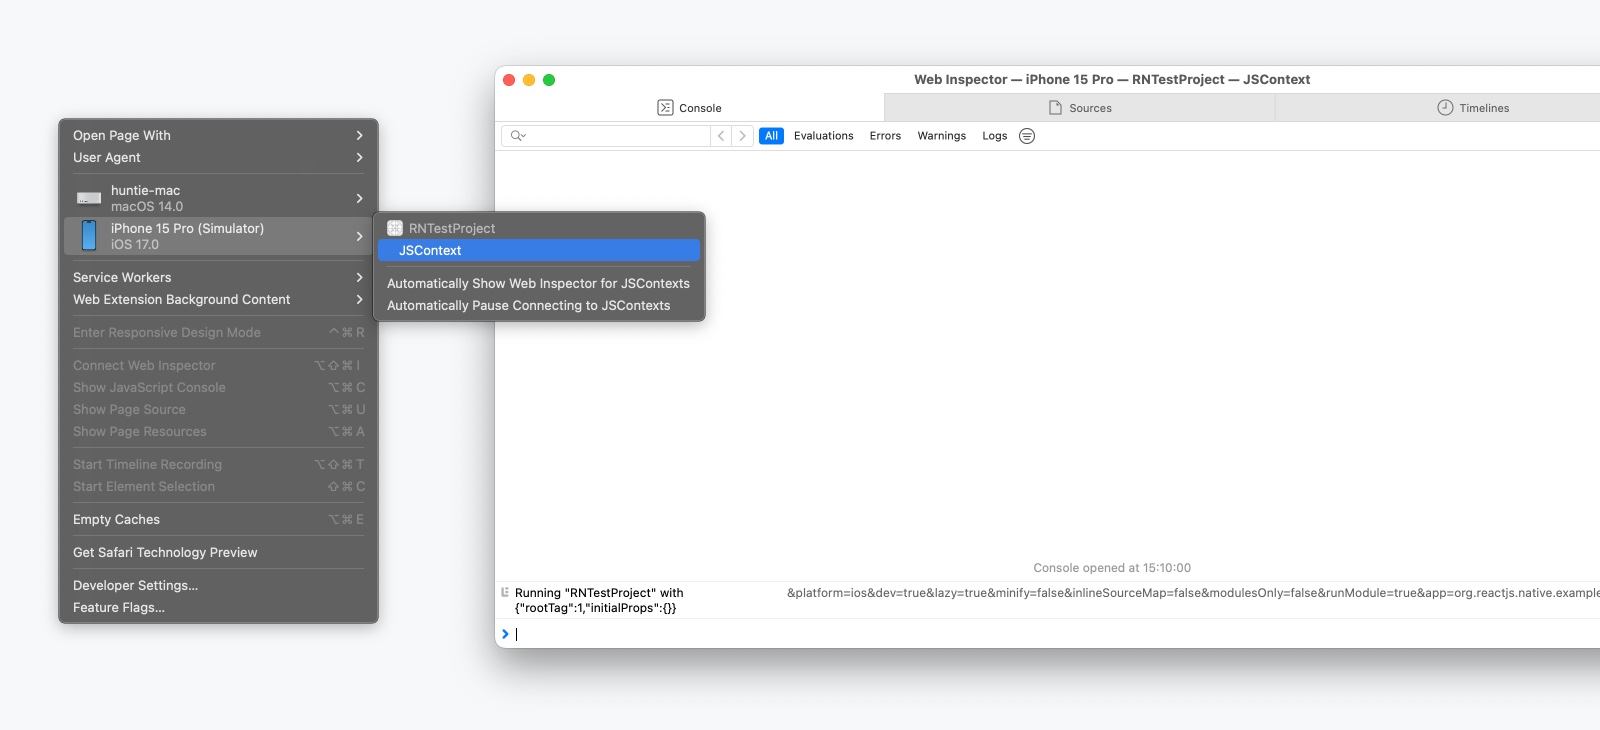
- Find your device under the Develop menu, and select the "JSContext" item from the submenu. This will open Safari's Web Inspector, which includes Console and Sources panels similar to Chrome DevTools.
While source maps may not be enabled by default, you can follow this guide or video to enable them and set break points at the right places in the source code.
Every time the app is reloaded, a new JSContext is created. Choosing "Automatically Show Web Inspectors for JSContexts" saves you from having to select the latest JSContext manually.
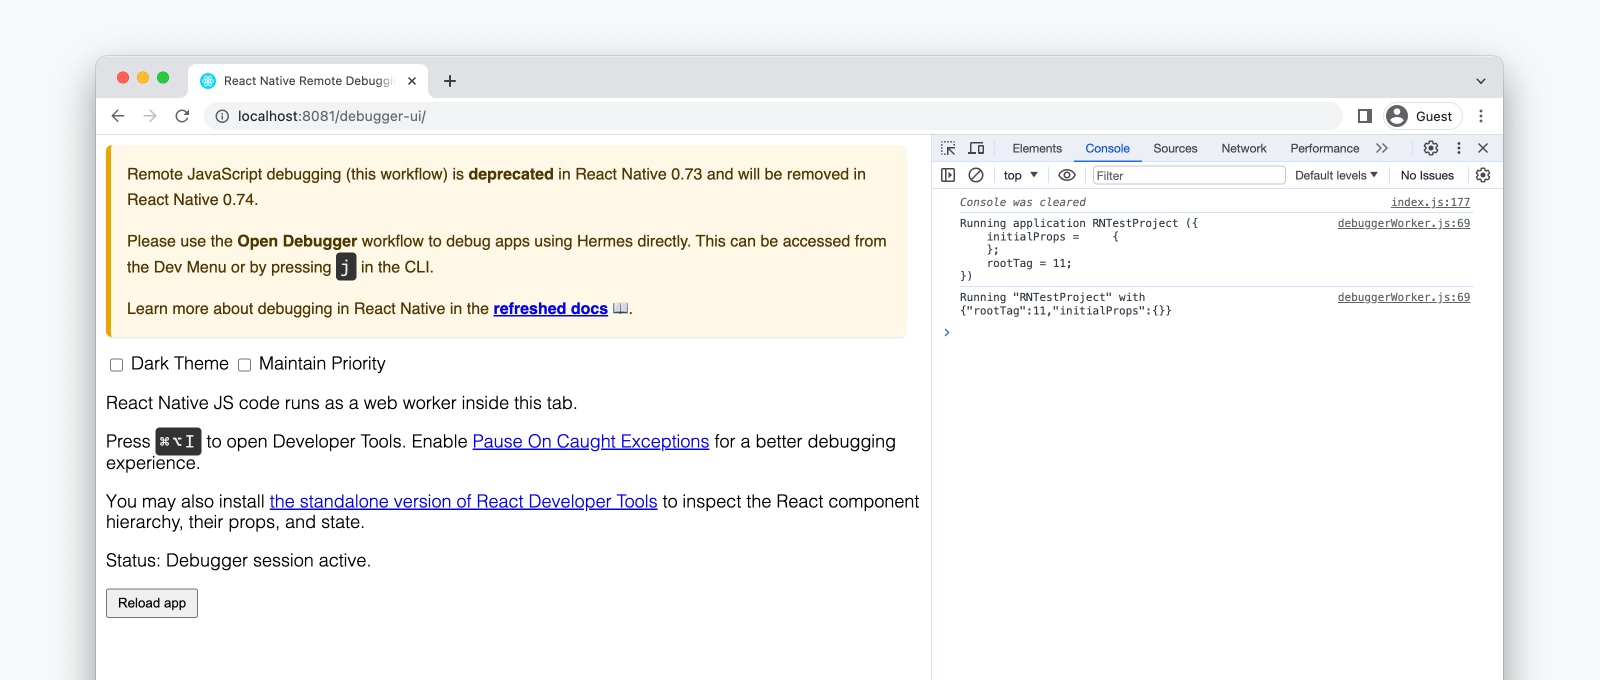
Remote JavaScript Debugging (removed)
Remote JavaScript Debugging has been removed as of React Native 0.79. See the original deprecation announcement.
If you are on an older version of React Native, please go to the docs for your version.