Profiling with Hermes
You can visualize JavaScript's performance in a React Native app using Hermes. Hermes is a small and lightweight JavaScript engine optimized for running React Native (you can read more about using it with React Native here). Hermes helps improve app performance and also exposes ways to analyze the performance of the JavaScript that it runs.
In this section, you will learn how to profile your React Native app running on Hermes and how to visualize the profile using the Performance tab on Chrome DevTools
Be sure to enable Hermes in your app before you get started!
Follow the instructions below to get started profiling:
- Record a Hermes sampling profile
- Execute command from CLI
- Open the downloaded profile on Chrome DevTools
Record a Hermes sampling profile
To record a sampling profiler from the Developer Menu:
- Navigate to your running Metro server terminal.
- Press
dto open the Developer Menu. - Select Enable Sampling Profiler.
- Execute your JavaScript by in your app (press buttons, etc.)
- Open the Developer Menu by pressing
dagain. - Select Disable Sampling Profiler to stop recording and save the sampling profiler.
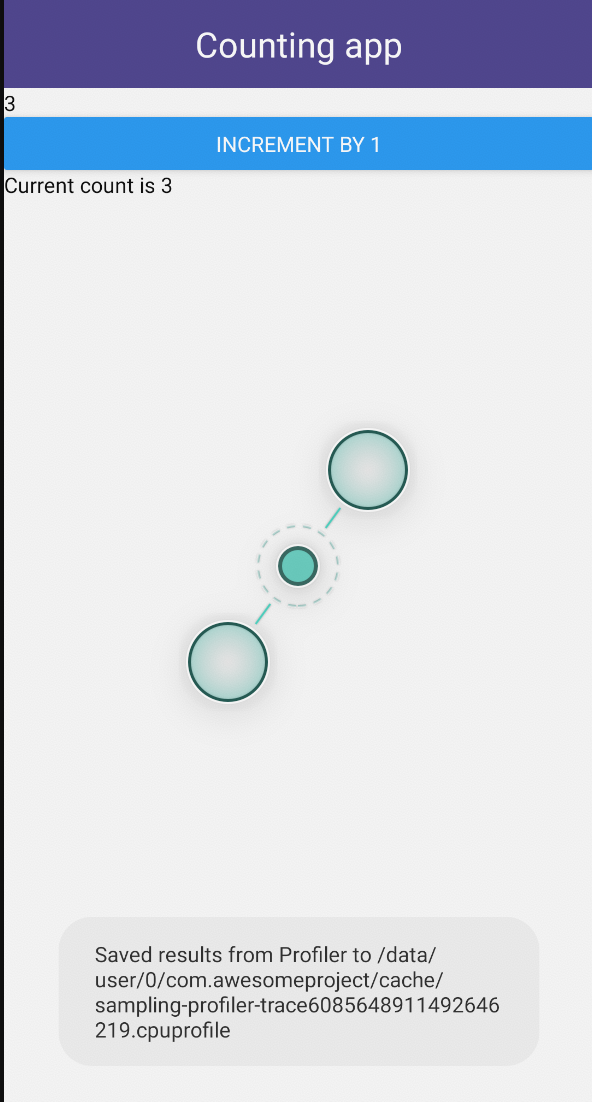
A toast will show the location where the sampling profiler has been saved, usually in /data/user/0/com.appName/cache/*.cpuprofile
Execute command from CLI
You can use the React Native CLI to convert the Hermes tracing profile to Chrome tracing profile, and then pull it to your local machine using:
npx react-native profile-hermes [destinationDir]
Enabling source map
A source map is used to enhance the profile and associate trace events with the application code. You can automatically generate a source map when converting the Hermes tracing profile to a Chrome tracing profile by enabling bundleInDebug if the app is running in development mode. This allows React Native to build the bundle during its running process. Here's how:
- In your app's
android/app/build.gradlefile, add:
project.ext.react = [
  bundleInDebug: true,
]
Be sure to clean the build whenever you make any changes to build.gradle
- Clean the build by running:
cd android && ./gradlew clean
- Run your app:
npx react-native run-android
Common errors
adb: no devices/emulators found or adb: device offline
- Why this happens The CLI cannot access the device or emulator (through adb) you are using to run the app.
- How to fix Make sure your Android device/emulator is connected and running. The command only works when it can access adb.
There is no file in the cache/ directory
- Why this happens The CLI cannot find any .cpuprofile file in your app's cache/ directory. You might have forgotten to record a profile from the device.
- How to fix Follow the instructions to enable/disable profiler from device.
Error: your_profile_name.cpuprofile is an empty file
- Why this happens The profile is empty, it might be because Hermes is not running correctly.
- How to fix Make sure your app is running on the latest version of Hermes.
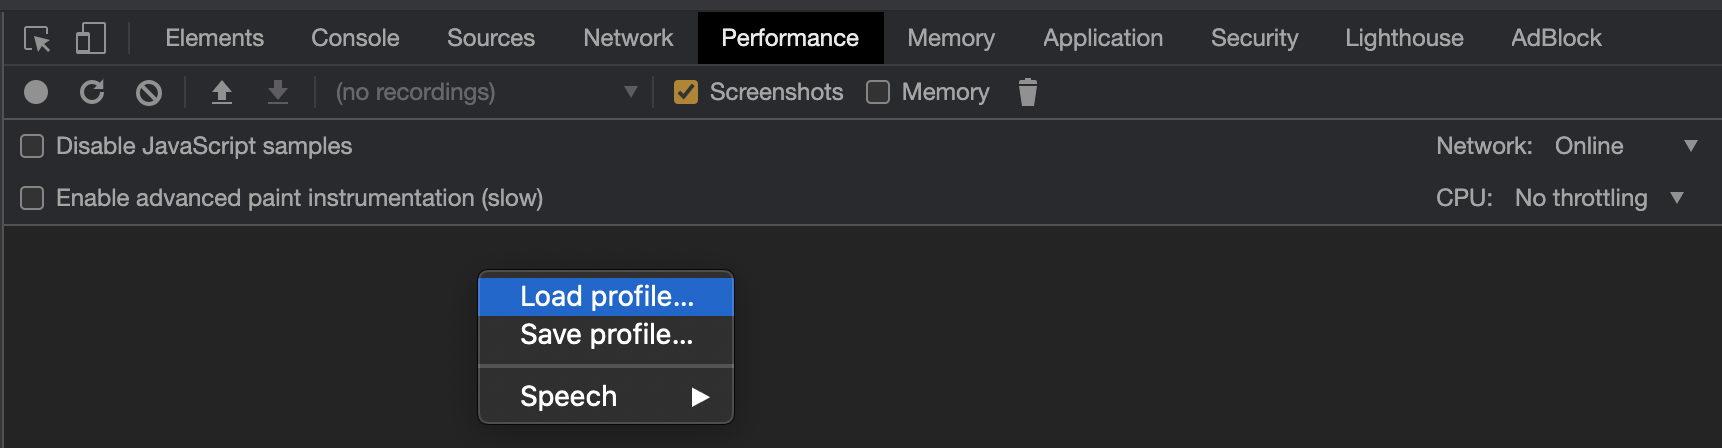
Open the downloaded profile in Chrome DevTools
To open the profile in Chrome DevTools:
- Open Chrome DevTools.
- Select the Performance tab.
- Right click and choose Load profile...
How does the Hermes Profile Transformer work?
The Hermes Sample Profile is of the JSON object format, while the format that Google's DevTools supports is JSON Array Format. (More information about the formats can be found on the Trace Event Format Document)
export interface HermesCPUProfile {
  traceEvents: SharedEventProperties[];
  samples: HermesSample[];
  stackFrames: {[key in string]: HermesStackFrame};
}
The Hermes profile has most of its information encoded into the samples and stackFrames properties. Each sample is a snapshot of the function call stack at that particular timestamp as each sample has a sf property which corresponds to a function call.
export interface HermesSample {
  cpu: string;
  name: string;
  ts: string;
  pid: number;
  tid: string;
  weight: string;
  /**
   * Will refer to an element in the stackFrames object of the Hermes Profile
   */
  sf: number;
  stackFrameData?: HermesStackFrame;
}
The information about a function call can be found in stackFrames which contains key-object pairs, where the key is the sf number and the corresponding object gives us all the relevant information about the function including the sf number of its parent function. This parent-child relationship can be traced upwards to find the information of all the functions running at a particular timestamp.
export interface HermesStackFrame {
  line: string;
  column: string;
  funcLine: string;
  funcColumn: string;
  name: string;
  category: string;
  /**
   * A parent function may or may not exist
   */
  parent?: number;
}
At this point, you should define a few more terms, namely:
- Nodes: The objects corresponding to
sfnumbers instackFrames - Active Nodes: The nodes which are currently running at a particular timestamp. A node is classified as running if its
sfnumber is in the function call stack. This call stack can be obtained from thesfnumber of the sample and tracing upwards till parentsfs are available
The samples and the stackFrames in tandem can then be used to generate all the start and end events at the corresponding timestamps, wherein:
- Start Nodes/Events: Nodes absent in the previous sample's function call stack but present in the current sample's.
- End Nodes/Events: Nodes present in the previous sample's function call stack but absent in the current sample's.
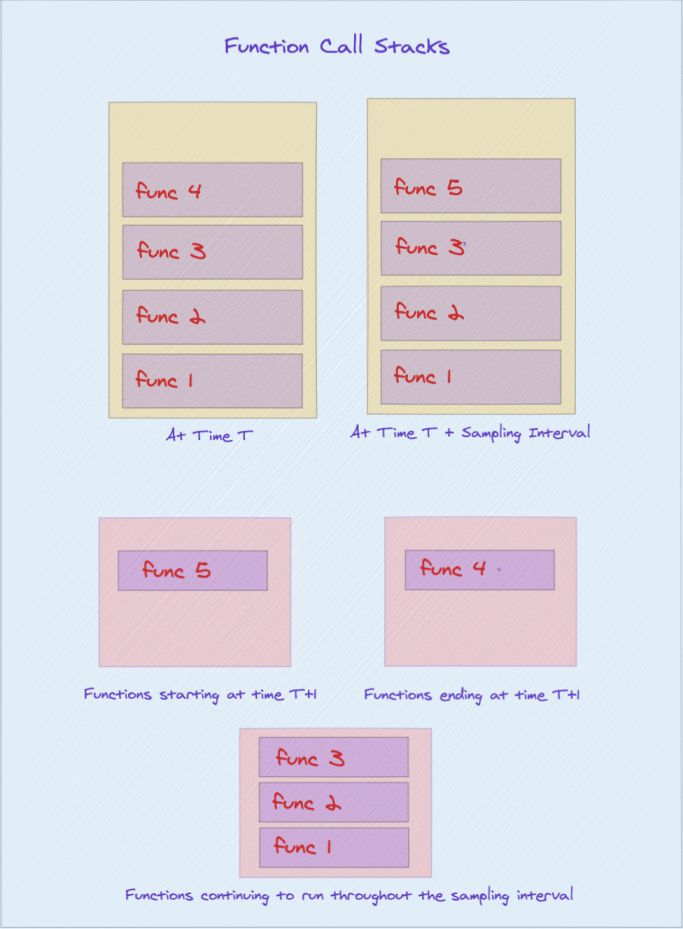
You can now construct a flamechart of function calls as you have all the function information including its start and end timestamps.
The hermes-profile-transformer can convert any profile generated using Hermes into a format that can be directly displayed in Chrome DevTools. More information about this can be found on @react-native-community/hermes-profile-transformer